Understanding Timing in Animation Part 4
Movement is essentially the cartoonist’s greatest tool for producing dynamic energy. Classical cartoon personality and energy comes from exaggeration and distortion in movement. When a Warner Bros. Looney Tunes character moves, they don't move like a real person they move in highly exaggerated and distorted fashion. They squash and stretch all over the place. When they run, parts of their body move at different rates of speed and they go through distortions and contortions that are anything but realistic, yet they are totally believable in a cartoon world. One of the first guidelines toward how to develop energy in a cartoon is the recognition that we want it to be believable not necessarily realistic.
Believable means we have to, for the most part, honor and account for the laws of nature and physics. Thanks to Sir Isaac Newton there are three laws that are well defined that govern most motions.
(1)The first law is the "law of inertia". An object at rest tends to stay at rest and an object in motion tends to stay in motion with the same speed and in the same direction unless acted upon by an unbalanced force. Simple stated if something is moving it is going to continue to move unaffected until some force or other object is encountered. Or, if something is stationary, it will remain stationary until some force is applied to get it moving.
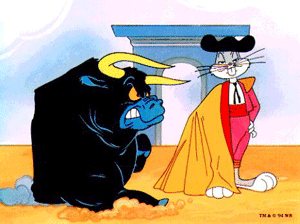
(2) The second law states that the acceleration of an object is dependent upon two variables - the net force acting upon the object and the mass of the object. Newton's second law provides the explanation for the behavior of objects upon which the forces do not balance. The second law states that unbalanced forces cause objects to accelerate with an acceleration which is directly proportional to the net force and inversely proportional to the mass. This one is telling us that big heavy objects don’t move as fast or as easily as smaller lighter objects. It takes more to slow down a charging bull then to slow down a charging mouse. It is very much in play when we are deciding how to show the acceleration or deceleration of an object.
(3) Newton’s third law: "For every action, there is an equal and opposite reaction." When you fire a gun you feel the recoil.
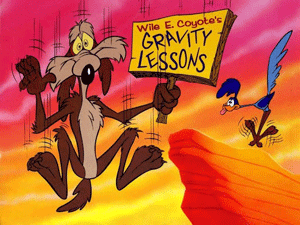
Newton’s laws are telling you that if you want to be believable than "may the forces be with you." The important concepts for creating believability all center on visualizing and using the effects of the forces at work in your cartoon world. Notice I didn’t say in the “real” world because some of the funniest things in cartoons follow physics that has been exaggerated or just plain ignored. Wyle Coyote hangs suspended in space over that canyon for a lot longer than an object would in reality, but it is the anticipation of the drop and Wyle's facial recognition of the upcoming pain that is so classically cartooney. So some laws are meant to be stretched for comical effect.
Now you all have seen or heard people refer to using a "line of action" in establishing a character's poses. And you may have heard them say it needs to be a "strong" line of action. But usually that's about it. Rarely does anyone ever really explain what "strong" is referring to or how these lines of action relate from pose to pose in their animations. The line of action in an animation sequence is directly reflecting the major influences of the forces at work. How the line twists and bends, snaps and recoils is all force driven. If you want to really capture energy in your actions just begin by animating the main line of action throughout the entire sequence. Then you can go back and begin to add the actual character’s structure on top. But don't make the mistake of trying to draw a full character pose and then another full character pose and then another full character pose and think that your animation will have a good flow or energy. Think in terms of major forces at work and use the line of action to capture and reflect those forces. Then think of the minor forces at work and you will capture them as drags overlaps and secondary actions. One useful approach to creating great poses is to work across a series of poses in an iterative manner. What that means is, that you do the main lines of action first for all the key poses and then make a second and third and even forth pass through those poses picking up and adding the lesser but equally important forces at work.
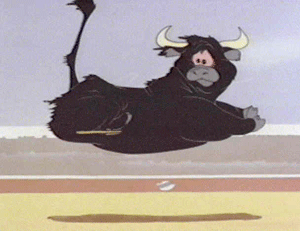
Illustrations are frozen on a single snapshot; animations are expressed in time across a sequence of images. So you want to create them across a sequence of images moving back and forth through the sequence in small steps building the action as you go. This way, long before your sequence will look like Bugs Bunny or whomever you're animating; it will capture the essence of the action with lots of fluid energy. The application of forces to objects is at the heart of timing in our animation creations. Therefore all your observations in planning how to animate an action need to include applying Newton’s laws. The audience expects things to behave according to the physical laws of nature and if you don’t show that in your timing of actions, the audience will instinctively detect and reject that aberration with the one exception that they will accept and laugh at variations that are obviously created to add to the gag being presented.
End of Part 4
Understanding Timing in Animation Part 3
Understanding Timing in Animation Part 2
Please read Understanding Timing in Animation Part 1 before continuing
Because timing is such an important part of an animated presentation, one of the best planning tools for any animator is a stop watch. You can get a great stop watch for estimating the timing of actions for less than $10 at most discount stores. Some people think they need a special “animator's” stop watch which has built in calculations for film footage and/or frames, but this isn't really needed. Footage is actually another way of representing the amount of time that something is shown on the screen. Depending on the size of the film stock used, you can calculate the number of feet or fractions of feet used to present a specified amount of screen time. Basically instead of saying something lasts on the screen for 16 frames at 24 FPS, you would say it lasts for 1 foot of 35mm film length. The length of film footage created per week has been used historically in many studios as a method of measuring production output. Footage is not a big deal in computer animation, we don’t think in terms of film stocks, and all that you need to calculate the needed number of frames is to know the FPS constant for your movie and then multiply it by the number of seconds or fractions of a second that you decide represents the action. Just remember you can’t have a fraction of a frame, so everything is rounded to the next whole frame.
Once you determine the speed, the spacing is largely a matter of intuition and visualization that comes from lots of practice and experience. Most animators come to understand and appreciate that the “pencil test” is a major often repeated step in the process of adjusting an action’s timing. Fortunately “pencil tests” are quick and easy to perform in the computer world. Each timing problem is unique and there are no simple formulas, it’s primarily a process of trial, adjustment and experience.
We will soon learn how to create and use “timing diagrams” which graphically represent the number of frames used and their relative spacing. An older term for these diagrams, which I also like, is to call them railway diagrams because they resemble a sort of train track. In a complex bit of character animation you will potentially create a number of different timing diagrams because there are many concurrent timing problems associated with the various parts of the performance. But there are more basics to cover before we layer on that complexity.
Rhythm and Beats:
Most timing of actions is based on rhythm. As animators we often learn to get a feel for the timing of an action by humming a little sort of rhythmic beat like “dum-de-dum”. Many animators tap the end of their pencils on their desk to get a feel for the beat. Here is a great trick I recently learned to use as a training aid for getting a better feel for timing rhythms. We can call these rhythm tests. For this example we will set up a movie time line with two seconds worth of frames. How many frames is that going to require? The answer is that it all depends on the presentation frame rate. Our chosen frame rate is 24 FPS. So how many frames do we need for a two second time line? The answer is 2 seconds X 24 FPS = 48 frames. So now we can visually simulate all kinds of timing rhythms by just creating a frame with a black matte that covers the entire movie screen. Then we can place additional copies of this black matte frame at some regular intervals along our timeline. For this example we will put one every 12th frame starting with frame 12. So that’s frames 12, 24, 36, and 48. Now go back and fill in all the other frames preceding each “black” frame with a blank frame or a “white” matte frame. Now you can publish the movie and you will have a timing rhythm that “flashes” a black timing frame every half second. Get the beat? Using this same technique you can set up different timing patterns and then observe them. It’s a neat way to develop a good sense for the various rhythms of timing.


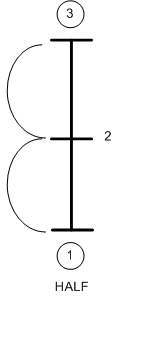
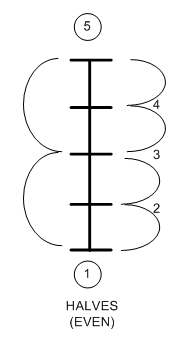 FIG 2
FIG 2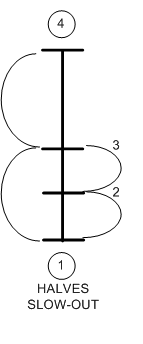
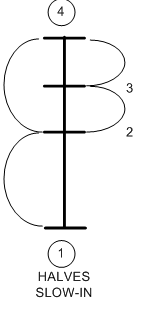 FIG 4
FIG 4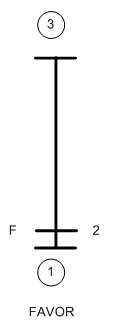 FIG 5
FIG 5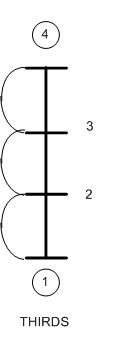 FIG 6
FIG 6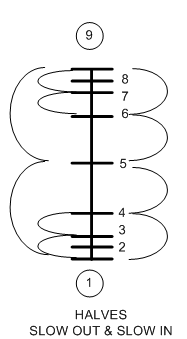 FIG 7
FIG 7